“More than 10 years ago, Amazon found that every 100ms of latency cost them 1% in sales”
Why does this matter?
Performance is a critical factor that significantly influences user experience and conversion rates. Fast-loading web pages ensure that users can access content quickly and efficiently, reducing the likelihood of frustration and abandonment.
In e-commerce and online transactions, this is particularly important as even minor delays can result in lost sales and decreased revenue. High performance not only enhances the user experience but also builds trust and encourages repeat visits, ultimately driving higher conversion rates and boosting customer loyalty. You can read more on improving conversion rates in this blog post.
Methodology
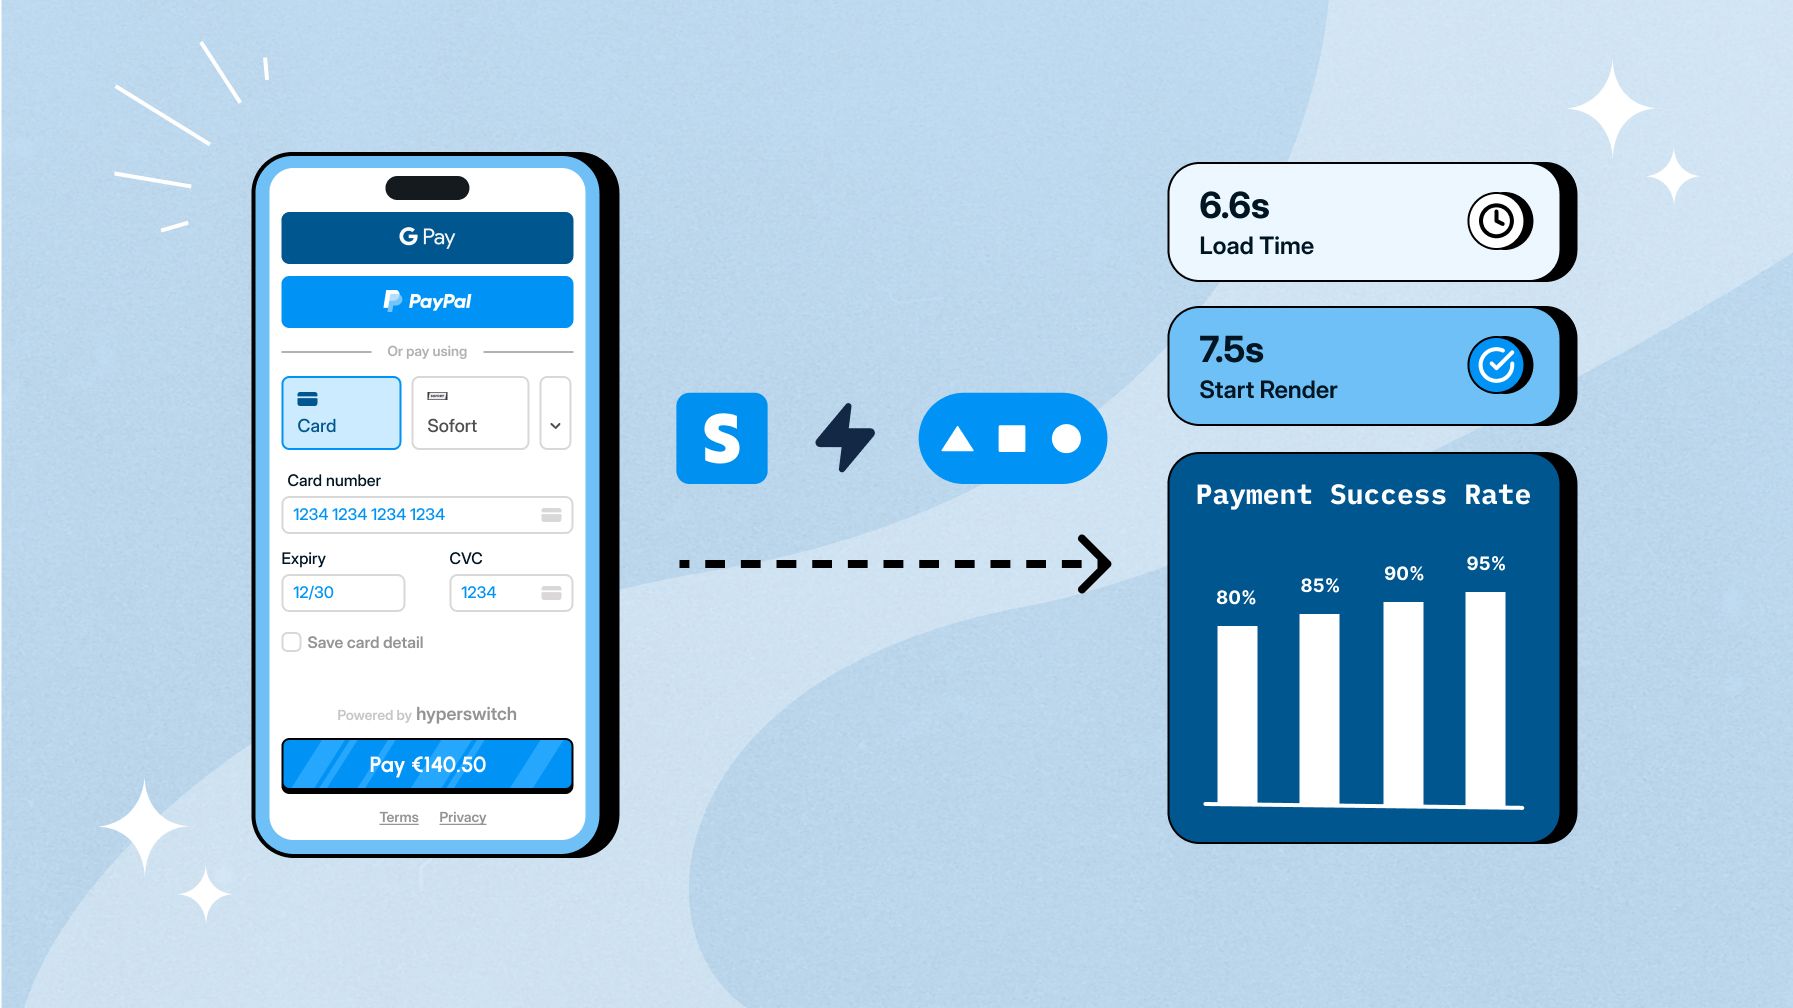
We started by benchmarking Hyperswitch Unified Checkout and Stripe Payment Element - by setting up a controlled environment, selecting the right tools, and carefully choosing the metrics to evaluate.
This setup included:
- Browser Configuration: Chrome v124.
- Network Conditions: 4G
- Location: Virginia, USA
- Payment Method: Card-only
- Environment: Sandbox
- Tool for benchmarking: WebPageTest by Catchpoint
To conduct the benchmarking, we built a lightweight demo application using Next.js. This app served as the test bed for evaluating the visual loading process of the pages. This setup allowed us to accurately measure key performance metrics and closely mimic real-world user experiences.
Most payment solutions offer javascript iframes to power the checkout experience and benchmarking web clients that load within an iframe is tricky. Traditional tools like Lighthouse and PageSpeed Insights are not suitable because they could not accurately measure the performance within an iframe. We decided to go with WebPageTest by Catchpoint, a tool known for its detailed and reliable performance metrics.
Results

Impact on User Experience
Each of these metrics plays a significant role in shaping the user experience:
- Time to First Byte: A quick server response time ensures that users do not have to wait long before the page begins to load, reducing perceived latency.
- Start Render: Seeing the first visual elements of a page quickly reassures users that the page is loading, reducing the likelihood of them abandoning the site.
- Visually Complete: Reaching a visually complete state quickly ensures that users perceive the page as fully loaded, enhancing their overall experience and reducing frustration.
- Load Time (Fully Loaded): Ensuring all elements are loaded promptly helps users interact with the page without waiting for additional resources, improving satisfaction.
- Speed Index: A lower speed index means that users can start interacting with the content faster, enhancing engagement and satisfaction.
- Cumulative Layout Shift: Stability during page load is crucial for maintaining user trust. Unexpected layout shifts can lead to misclicks and frustration, detracting from the user experience.
- Total Blocking Time: Minimizing blocking time ensures that the page remains responsive to user interactions, which is essential for a smooth and interactive experience.
- CPU Busy Time: Reducing CPU busy time ensures that the page is processed efficiently, maintaining responsiveness and smooth interactions.
- Page Weight: Optimizing the page weight reduces load times and data usage, which is particularly important for users on slower connections or with data caps.
- Number of Requests: Minimizing the number of requests reduces the load on the server and speeds up the loading process, contributing to a faster and more efficient user experience.
Extend to Production Environment
The metrics observed for Hyperswitch in the sandbox environment are not only closely aligned with those in the production environment but, in fact, show even better performance in production. This means that the speed, responsiveness, and efficiency seen in testing in a sandbox environment are actually surpassed in real-world conditions. Find more here:
1. Hyperswitch Catchpoint Report
3. Hyperswitch Catchpoint Report (Production)
In this comparison of card-only web clients, both Hyperswitch and Stripe perform admirably. Hyperswitch demonstrates slightly faster rendering and overall load times, which can be beneficial for applications where speed is a top priority. It achieves visual completeness more quickly and has a lower CPU busy time, contributing to a smoother user experience. Stripe, on the other hand, offers a wide range of features with a more modest page weight and fewer instances of blocking time, which can be advantageous in maintaining steady performance under varying conditions.
In our next article, we'll dive deeper into the performance metrics and optimization strategies that make the Hyperswitch Web client so effective. We'll explore the advanced techniques and technologies that drive its superior speed and efficiency, providing you with actionable insights to enhance your own web applications. Stay tuned to discover how Hyperswitch achieves its impressive performance and how you can apply these optimizations to deliver exceptional user experiences.