
Every PSP dashboard shows accurate data. It shows accurate data for only the transactions that PSP processed. If you're routing across Stripe, Adyen, and Worldpay and you're making payment decisions from any one of those dashboards, you're working from 33% to 60% of your actual transaction picture. The charts look complete because they're polished and the data is real. But the question you actually need answered, say, whether Stripe outperforms Adyen for Amex transactions, requires data from both systems at once, mapped to the same schema. Neither dashboard can answer that on its own. And if you've never unified the data, both dashboards together still can't.
For merchants running multiple PSPs, the most consequential payment questions are often the ones their current setup has no way to answer.
Blind spot 1: You can't compare PSP performance without normalizing the data first
Every PSP has its own field names, decline reason codes, status labels, and settlement timing conventions. None of them match.
Stripe calls a successful authorization "succeeded". Adyen calls it "AUTHORISED". Worldpay has its own vocabulary entirely. A soft decline on Stripe carries a different reason code structure than a soft decline on Adyen. Some PSPs report settlement amounts net of fees. Others report gross, which means you need a fee reconciliation step before you can compare net revenue per transaction across connectors.
Until you solve the normalization problem, cross-PSP comparison isn't really a comparison at all. Running an authorization rate analysis across raw PSP data without standardising the decline taxonomies produces a chart that looks like performance data but is partly just measuring how each PSP names the same thing.
What normalisation unlocks
Once every transaction record maps to a consistent schema, with common status labels, common decline categories, gross or net representation applied consistently, and timestamps in a single timezone, a whole class of questions becomes answerable:
- Which connector authorises Visa debit at the highest rate for domestic transactions?
- Which connector has the lowest PSP error rate, not issuer decline rate, but actual processing errors?
- Which connector is cheapest for cross-border EUR transactions once all fee components are included?
- Which connector has the fastest average response time, and does that correlate with checkout abandonment on mobile?
None of these questions can be answered from a single PSP. All of them can be answered from normalised, unified data. And all of them have direct routing, cost, and configuration implications.
Blind spot 2: Your effective PSP fees are much more complex than the rate card
The fee rate in your PSP contract is not the fee you actually pay per transaction. The effective fee is the contracted rate plus interchange (which varies by card type, issuer country, and network), plus scheme fees, plus cross-border fees for international cards, plus currency conversion margin for multi-currency settlement, plus minimum monthly fees, plus any other charges that accumulate in ways the per-transaction data doesn't surface.
Each PSP in your stack has a different fee structure, different interchange passthrough terms, and different currency conversion margins. Without a unified view of effective fees across all your connectors, you can't answer the question that drives routing optimization: for this specific transaction, with this card type, from this geography, at this amount, which connector is actually cheapest after everything is counted?
The three fee components that vary most across PSPs
Interchange passthrough structure
Some PSPs pass interchange through at cost, what's called IC++ pricing. Others bundle it into a blended rate. IC++ is cheaper for low-interchange transactions like debit cards and regulated cards, and more expensive for high-interchange transactions like premium rewards Visa or corporate cards. If you're on IC++ at Adyen and blended pricing at Stripe, you're paying materially different effective fees for the same transaction at each connector. Comparing them requires extracting interchange from both settlement reports, which have different formats.
Cross-border transaction fees
When a US merchant processes a card from a European cardholder, most PSPs charge an additional cross-border fee on top of standard interchange. This fee varies considerably across connectors, ranging from below 0.5% at some to over 1.5% at others for the same card type. For merchants with meaningful international volume, the cross-border fee gap across PSPs is often the largest single cost optimization available. It's also the one least likely to be tracked, because finding it requires combining transaction geography data with fee data from each PSP's settlement report.
Currency conversion margin
For merchants who settle in a currency different from the transaction currency, each PSP applies a conversion margin on top of the mid-market rate. These margins vary by PSP and are not always prominently disclosed. A 0.5% margin difference on $10M of annual cross-currency volume is $50,000 per year. That's a routing decision that costs nothing to implement once you can see it, but requires fee-data from multiple PSPs to identify.
Merchants who route on authorisation rate alone, without factoring in the effective fee by transaction profile, are optimizing one revenue lever while leaving cost reduction sitting there. The optimal routing formula maximizes (authorization rate multiplied by revenue per authorized transaction) minus (effective processing fee per transaction). Both sides of that equation require cross-PSP data.
Blind spot 3: Checkout abandonment is more under-reported than you think
Payment analytics that start at the authorization attempt misses a whole category of revenue loss that happens before any authorization: customers who reach the payment page and leave before submitting.
PSP dashboards measure authorization rate as a percentage of submitted payment attempts. They don't measure, and aren't designed to measure, the percentage of customers who reached the payment page but didn't attempt to pay at all. That metric lives in checkout funnel data, not payment data.
The connection most payment teams miss
A meaningful share of payment page abandonment is driven by payment configuration. Customers leave when:
- Their preferred payment method isn't offered, whether that's a wallet, BNPL, or a local payment method they expect.
- The checkout is too slow because PSP response time creates a perceived loading delay.
- 3DS friction appears unexpectedly for a returning customer who wasn't challenged last time.
- The card form looks untrustworthy on mobile, with no recognised payment brand logos or an unfamiliar layout.
Each of these has a signal in payment data, but only when payment analytics connect to checkout behavior data. The 3DS abandonment signal: authentication success rate looks fine, but payment attempts are down relative to sessions that reached the payment page. The missing payment method signal: transaction mix shows disproportionately low wallet volume relative to device type, with mobile users who would expect Apple Pay or Google Pay falling back to a card form.
Juspay's checkout layer, deployed across enterprise merchants processing over 300 million daily transactions, makes these connections visible by linking checkout session data to payment attempt data to authorization data in a single instrumented flow. Payment page abandonment with a payment configuration root cause shows up alongside authorization and decline analytics, rather than disappearing into web analytics, where nobody connects it back to payments.
Payment analytics that only measure what was attempted underestimates revenue loss. You need checkout funnel data connected to payment configuration data to see both the authorization-stage and pre-authorization-stage losses.
Blind spot 4: T+1 settlement data means real-time decisions run on yesterday's numbers
PSP settlement reports are typically available the next business day, T+1. Bank statements arrive T+1 to T+2. For most payment analytics use cases, that lag is fine.
For three specific decisions, it isn't.
Downtime detection
A PSP degradation event that starts at 2pm produces elevated decline rates that will appear in tomorrow's settlement report. A payment team relying on settlement data to catch PSP issues won't see the signal until the following morning, after 12 to 14 hours of sub-optimal routing. Real-time authorisation data, not settlement data, is the right monitoring layer for PSP health.
Fraud pattern detection
A surge in declined transactions sharing similar BIN ranges, geographies, or device fingerprints is an early fraud signal. Settlement data carries that signal, but with a lag that lets a fraud pattern run for 24 hours before it's visible. Real-time transaction monitoring using authorization attempt data compresses that detection window from hours to minutes.
Checkout A/B test measurement
A/B tests on checkout configuration, whether that's payment method order, 3DS thresholds, or UI changes, produce authorization rate signals that are only meaningful when measured close to real time. Waiting for T+1 settlement data to evaluate test performance extends test duration and delays deployment of winning configurations for no good reason.
What this means in practice
A complete payment analytics architecture needs two data layers: a real-time stream for monitoring and operational decisions, and a T+1/T+2 batch layer for reconciliation, cost analysis, and trend reporting. Most merchants only have the batch layer. The gaps where they're flying blind, PSP health monitoring, fraud detection, and A/B test measurement, are exactly the high-cost, time-sensitive decisions where the lag hurts most.
What a complete payment data view actually requires
Closing these four blind spots requires three capabilities that PSP-native tools don't provide.
Cross-PSP data normalization
Transaction records from all connected PSPs are mapped to a consistent schema: common status labels, a common decline reason taxonomy, standardized fee representation (gross or net, applied consistently), and timestamps normalized to a single timezone. Without this step, cross-PSP comparison is just comparing incompatible data.
Real-time authorization data stream
A feed of authorization attempt outcomes, not settlement data, is available within seconds of each transaction. This enables PSP health monitoring, fraud pattern detection, and live A/B test measurement. Most PSPs provide webhooks for exactly this purpose. The same normalization layer that applies to your batch data should apply to the real-time stream too.
Checkout-to-authorization instrumentation
A connection between checkout funnel behavior, sessions, payment method selections, abandonment points, and authorization outcomes. This is what makes pre-authorisation abandonment with a payment configuration root cause visible alongside post-authorisation analytics.
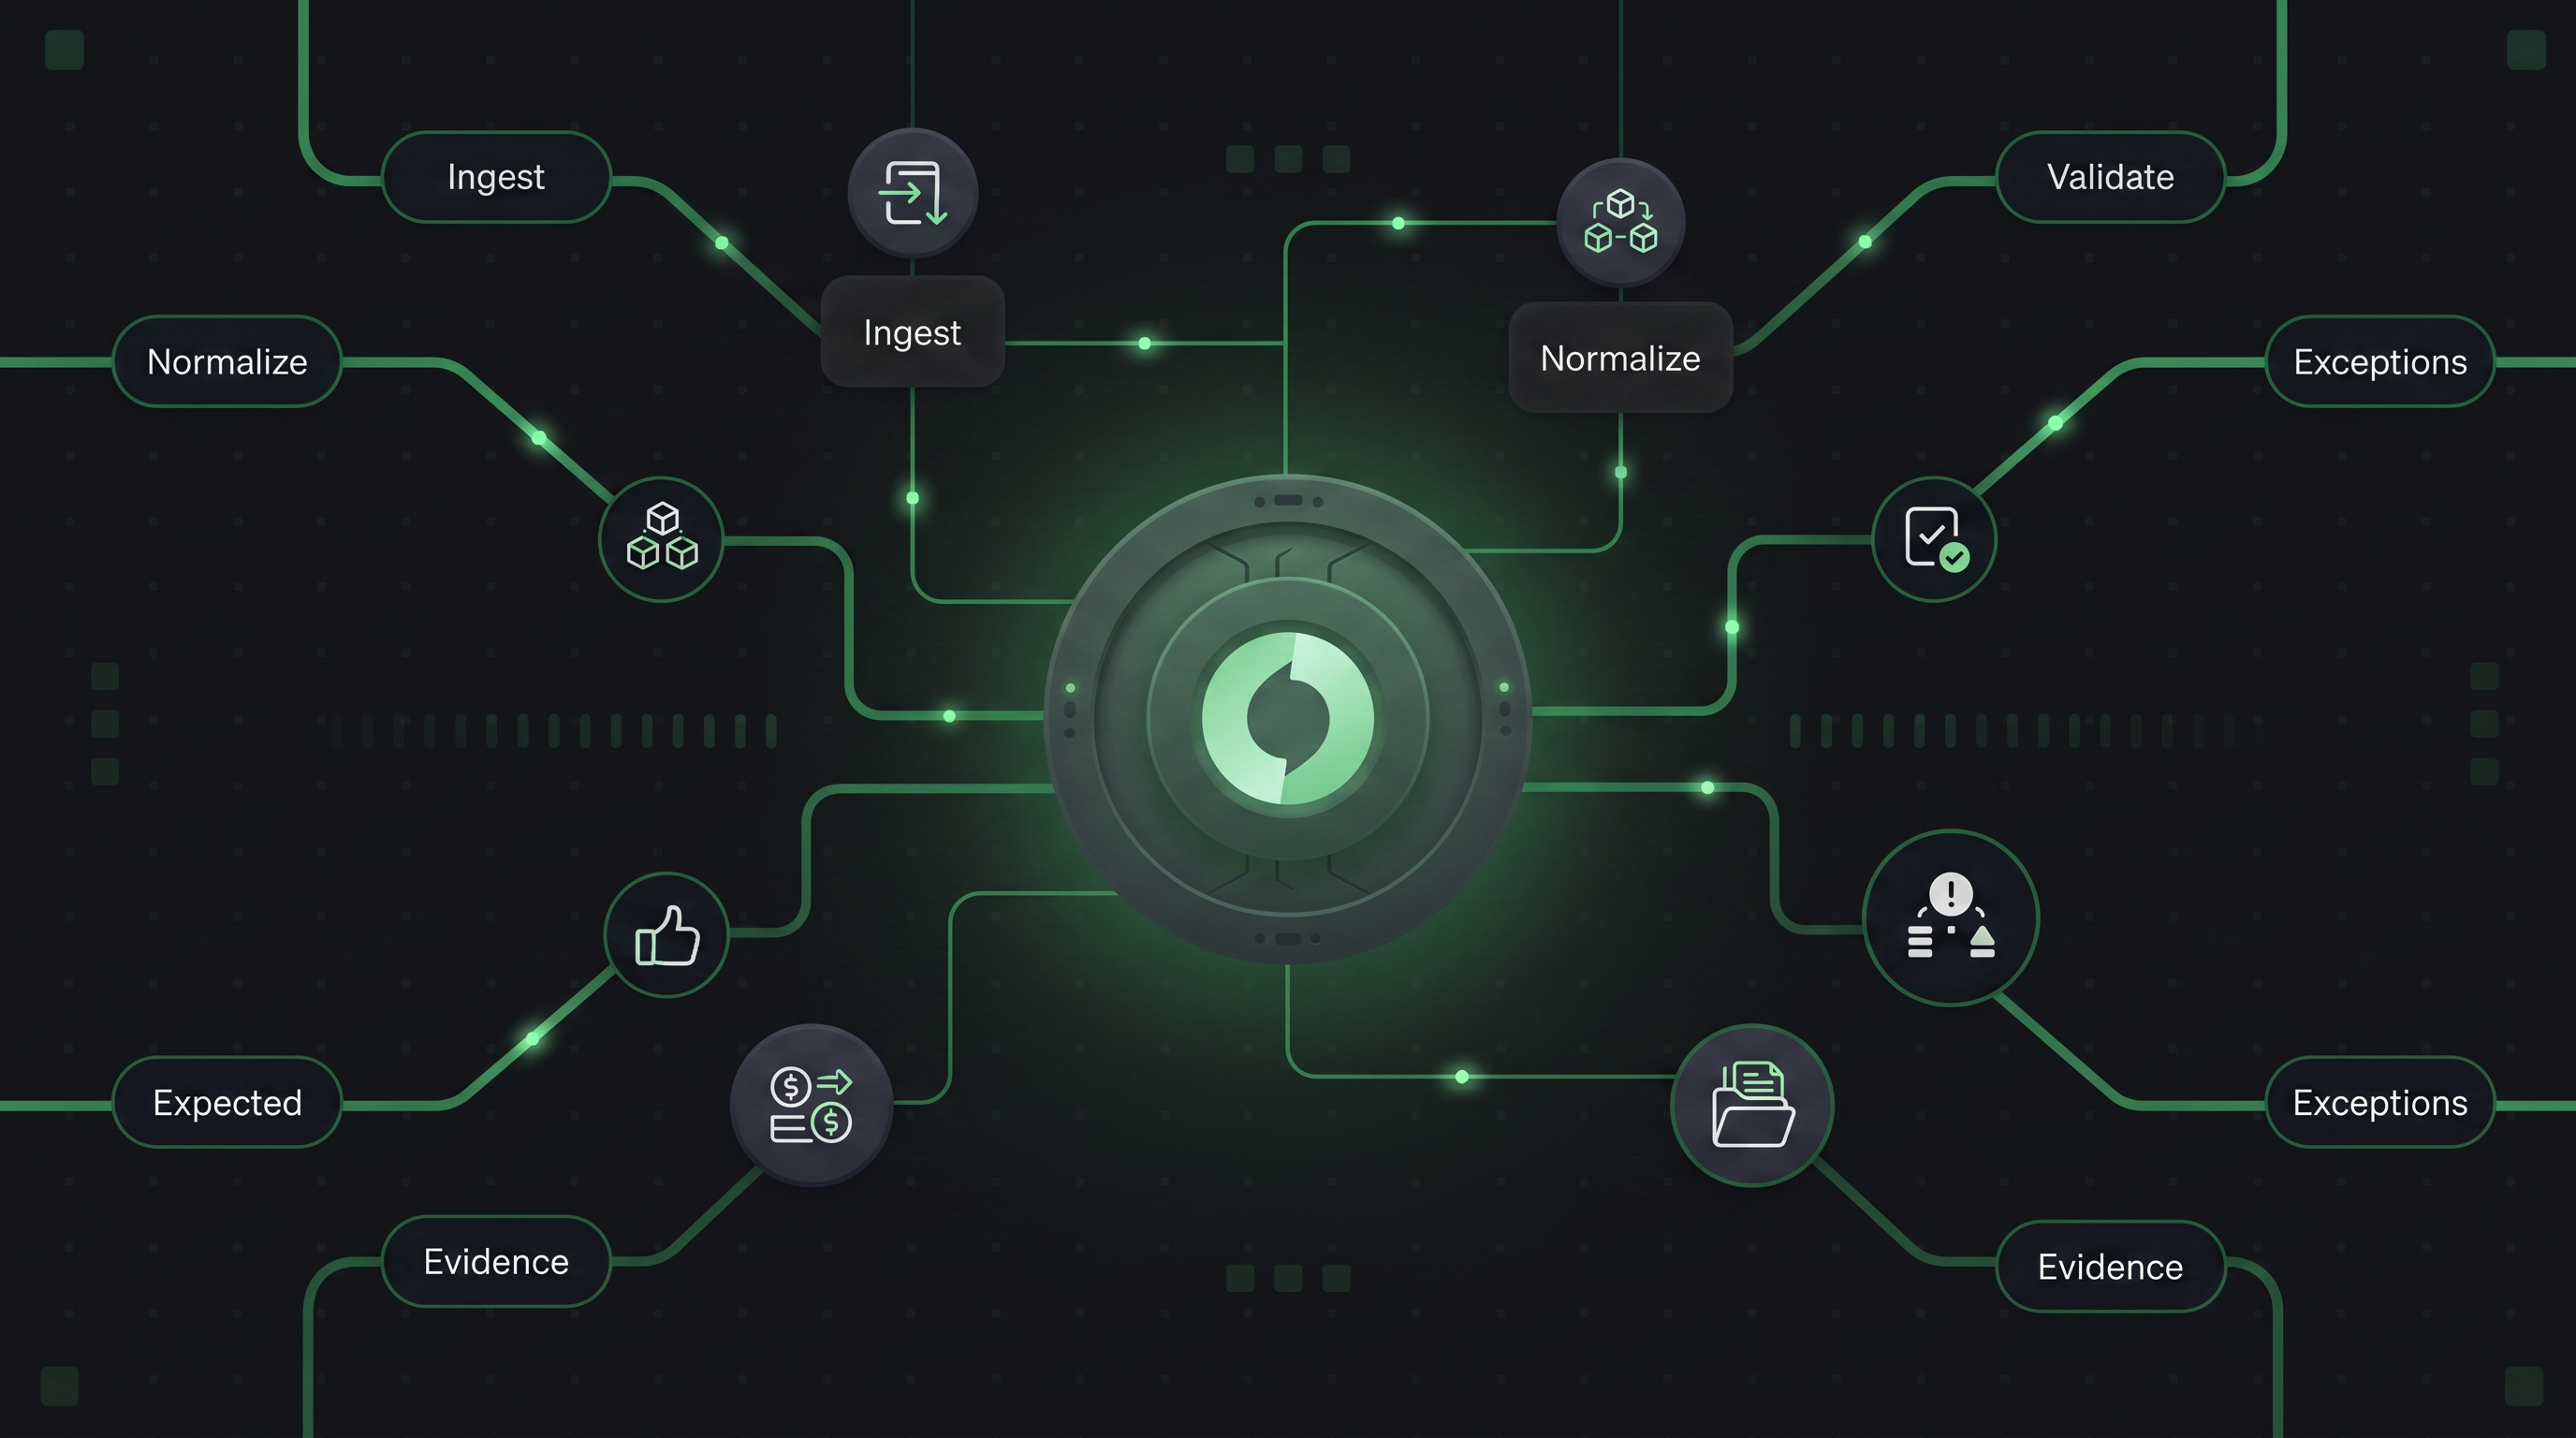
Juspay's unified orchestration layer provides this architecture for enterprise merchants: a normalised cross-PSP data view, real-time authorisation event streaming, and checkout instrumentation, all in one layer above the individual PSPs. For merchants processing across Stripe, Adyen, Worldpay, and other connectors, this removes the need to build and maintain separate data pipelines from each PSP and a custom normalisation layer on top.
Key takeaways
- PSP-native dashboards show accurate data for their own transaction volume. They tell you nothing about comparative performance across connectors.
- Cross-PSP authorization rate comparisons require normalizing status labels, decline reason codes, and fee representations to a consistent schema first. Raw PSP data comparisons partly measure taxonomy differences, not actual performance.
- Effective processing fees vary by card type, geography, and currency across PSPs. Routing on authorization rate alone leaves cost optimization untouched.
- Checkout abandonment caused by payment configuration issues, missing payment methods, and unexpected 3DS friction does not appear in the authorization rate data. You need checkout funnel data connected to payment configuration data to see it.
- T+1 settlement data creates a monitoring lag, making it unsuitable for PSP health detection, fraud pattern detection, and A/B test measurement. These require a real-time authorization data stream.
- A complete payment analytics architecture needs three layers: cross-PSP normalized data, real-time authorization streaming, and checkout-to-authorization instrumentation.
Frequently asked questions
Why can't I just use my PSP's analytics dashboard for payment insights?
PSP dashboards are accurate for the transactions they processed, but they only see their own data. A merchant using three PSPs cannot answer cross-PSP questions from any single dashboard. Beyond the coverage gap, PSP dashboards typically don't connect to checkout funnel data, don't surface cross-border fee variance, and don't provide the real-time authorisation stream needed for PSP health monitoring. They're useful for connector-specific reporting. They're not sufficient for payment optimization.
What does payment data normalization mean in practice?
Normalization means mapping transaction records from all PSPs to a consistent schema: standardising status labels (so Stripe's 'succeeded' and Adyen's 'AUTHORISED' become the same status), mapping decline reason codes to a common taxonomy (so 'soft decline' means the same thing across PSPs), standardising amount representation (gross vs. net of fees, applied consistently), and normalising timestamps to a single timezone. Without this, a dataset that looks like cross-PSP payment data is actually records from different systems using different vocabularies. Conclusions drawn from it may be measuring vocabulary differences rather than performance differences.
How do effective PSP processing fees differ from the rate card?
The rate card is the per-transaction fee agreed upon in the contract. The effective fee per transaction includes interchange (which can swing 0.5% to 2% depending on card type), scheme fees, cross-border fees for international cards, currency conversion margins for multi-currency settlement, and minimum monthly fees. IC++ pricing passes interchange through at cost. Blended pricing bundles it. For a merchant with a mix of domestic debit, domestic premium credit, and international cards, the effective fee per transaction varies considerably across connectors, and cross-PSP fee comparison requires extracting and normalising all fee components from each PSP's settlement report.
What payment metrics should I track in real time versus in batch?
The split comes down to what the decision costs you if it's made on stale data. Authorization success rate by connector, decline rate by BIN range and geography, and authorization rate by A/B test variant all need to be visible within seconds to minutes. These drive PSP health monitoring, fraud detection, and checkout experiments, where a 24-hour lag means the damage is already done. Settlement amounts, effective fees, chargeback data, cross-PSP comparisons by segment, and checkout funnel conversion are all fine to review in batch at T+1 or T+2. The real-time layer tells you what's happening right now. The batch layer tells you whether your strategy is working.
How does checkout abandonment connect to payment analytics?
Checkout abandonment caused by payment configuration problems, missing preferred payment methods, unexpected 3DS friction for returning customers, slow PSP response times on mobile, doesn't appear in authorisation rate data because the customer never reached the authorisation attempt. It shows up in checkout funnel data as a drop between 'reached payment page' and 'submitted payment.' Connecting payment configuration data to checkout funnel data makes the causes visible. A spike in payment page abandonment on mobile that correlates with a day Apple Pay was temporarily unavailable is a payment analytics insight, not just a web analytics one.
What is the T+1 lag problem in payment analytics?
PSP settlement reports are typically available the next business day. For most payment analytics, cost analysis, trend reporting, and reconciliation, that lag is manageable. For three decisions, it creates a costly blind spot: PSP downtime detection (a degradation event at 2pm won't appear in analytics until the next morning, after hours of sub-optimal routing), fraud pattern detection (new fraud attacks run for 24 hours before appearing in settlement data), and A/B test measurement (waiting for T+1 test results unnecessarily extends experiment duration). These decisions require a real-time authorization data stream, webhook-based authorization event data, not settlement data.
How does payment orchestration improve payment analytics?
Payment orchestration provides a centralized layer that processes all transactions across all PSPs, producing cross-PSP normalized data as a byproduct of routing. Because the orchestration layer sees every transaction regardless of which PSP it routes to, it can provide cross-PSP authorization rate comparison, normalized decline reason analysis, and effective fee analytics without requiring the merchant to build separate data pipelines from each PSP.