
A chargeback doesn't just reverse the sale: it triggers a dispute fee ($15 - $100 per incident), consumes 15 - 45 minutes of your team's time to respond, and reduces your authorization rate if your ratio climbs. Cross the program thresholds set by your card networks, and your merchant account is under active monitoring. For most merchants, the transaction value is the only cost they track. The operational, financial, and compliance costs sitting beneath it are two to three times larger, and almost entirely preventable with the right payment infrastructure.
What does a chargeback actually cost a merchant?
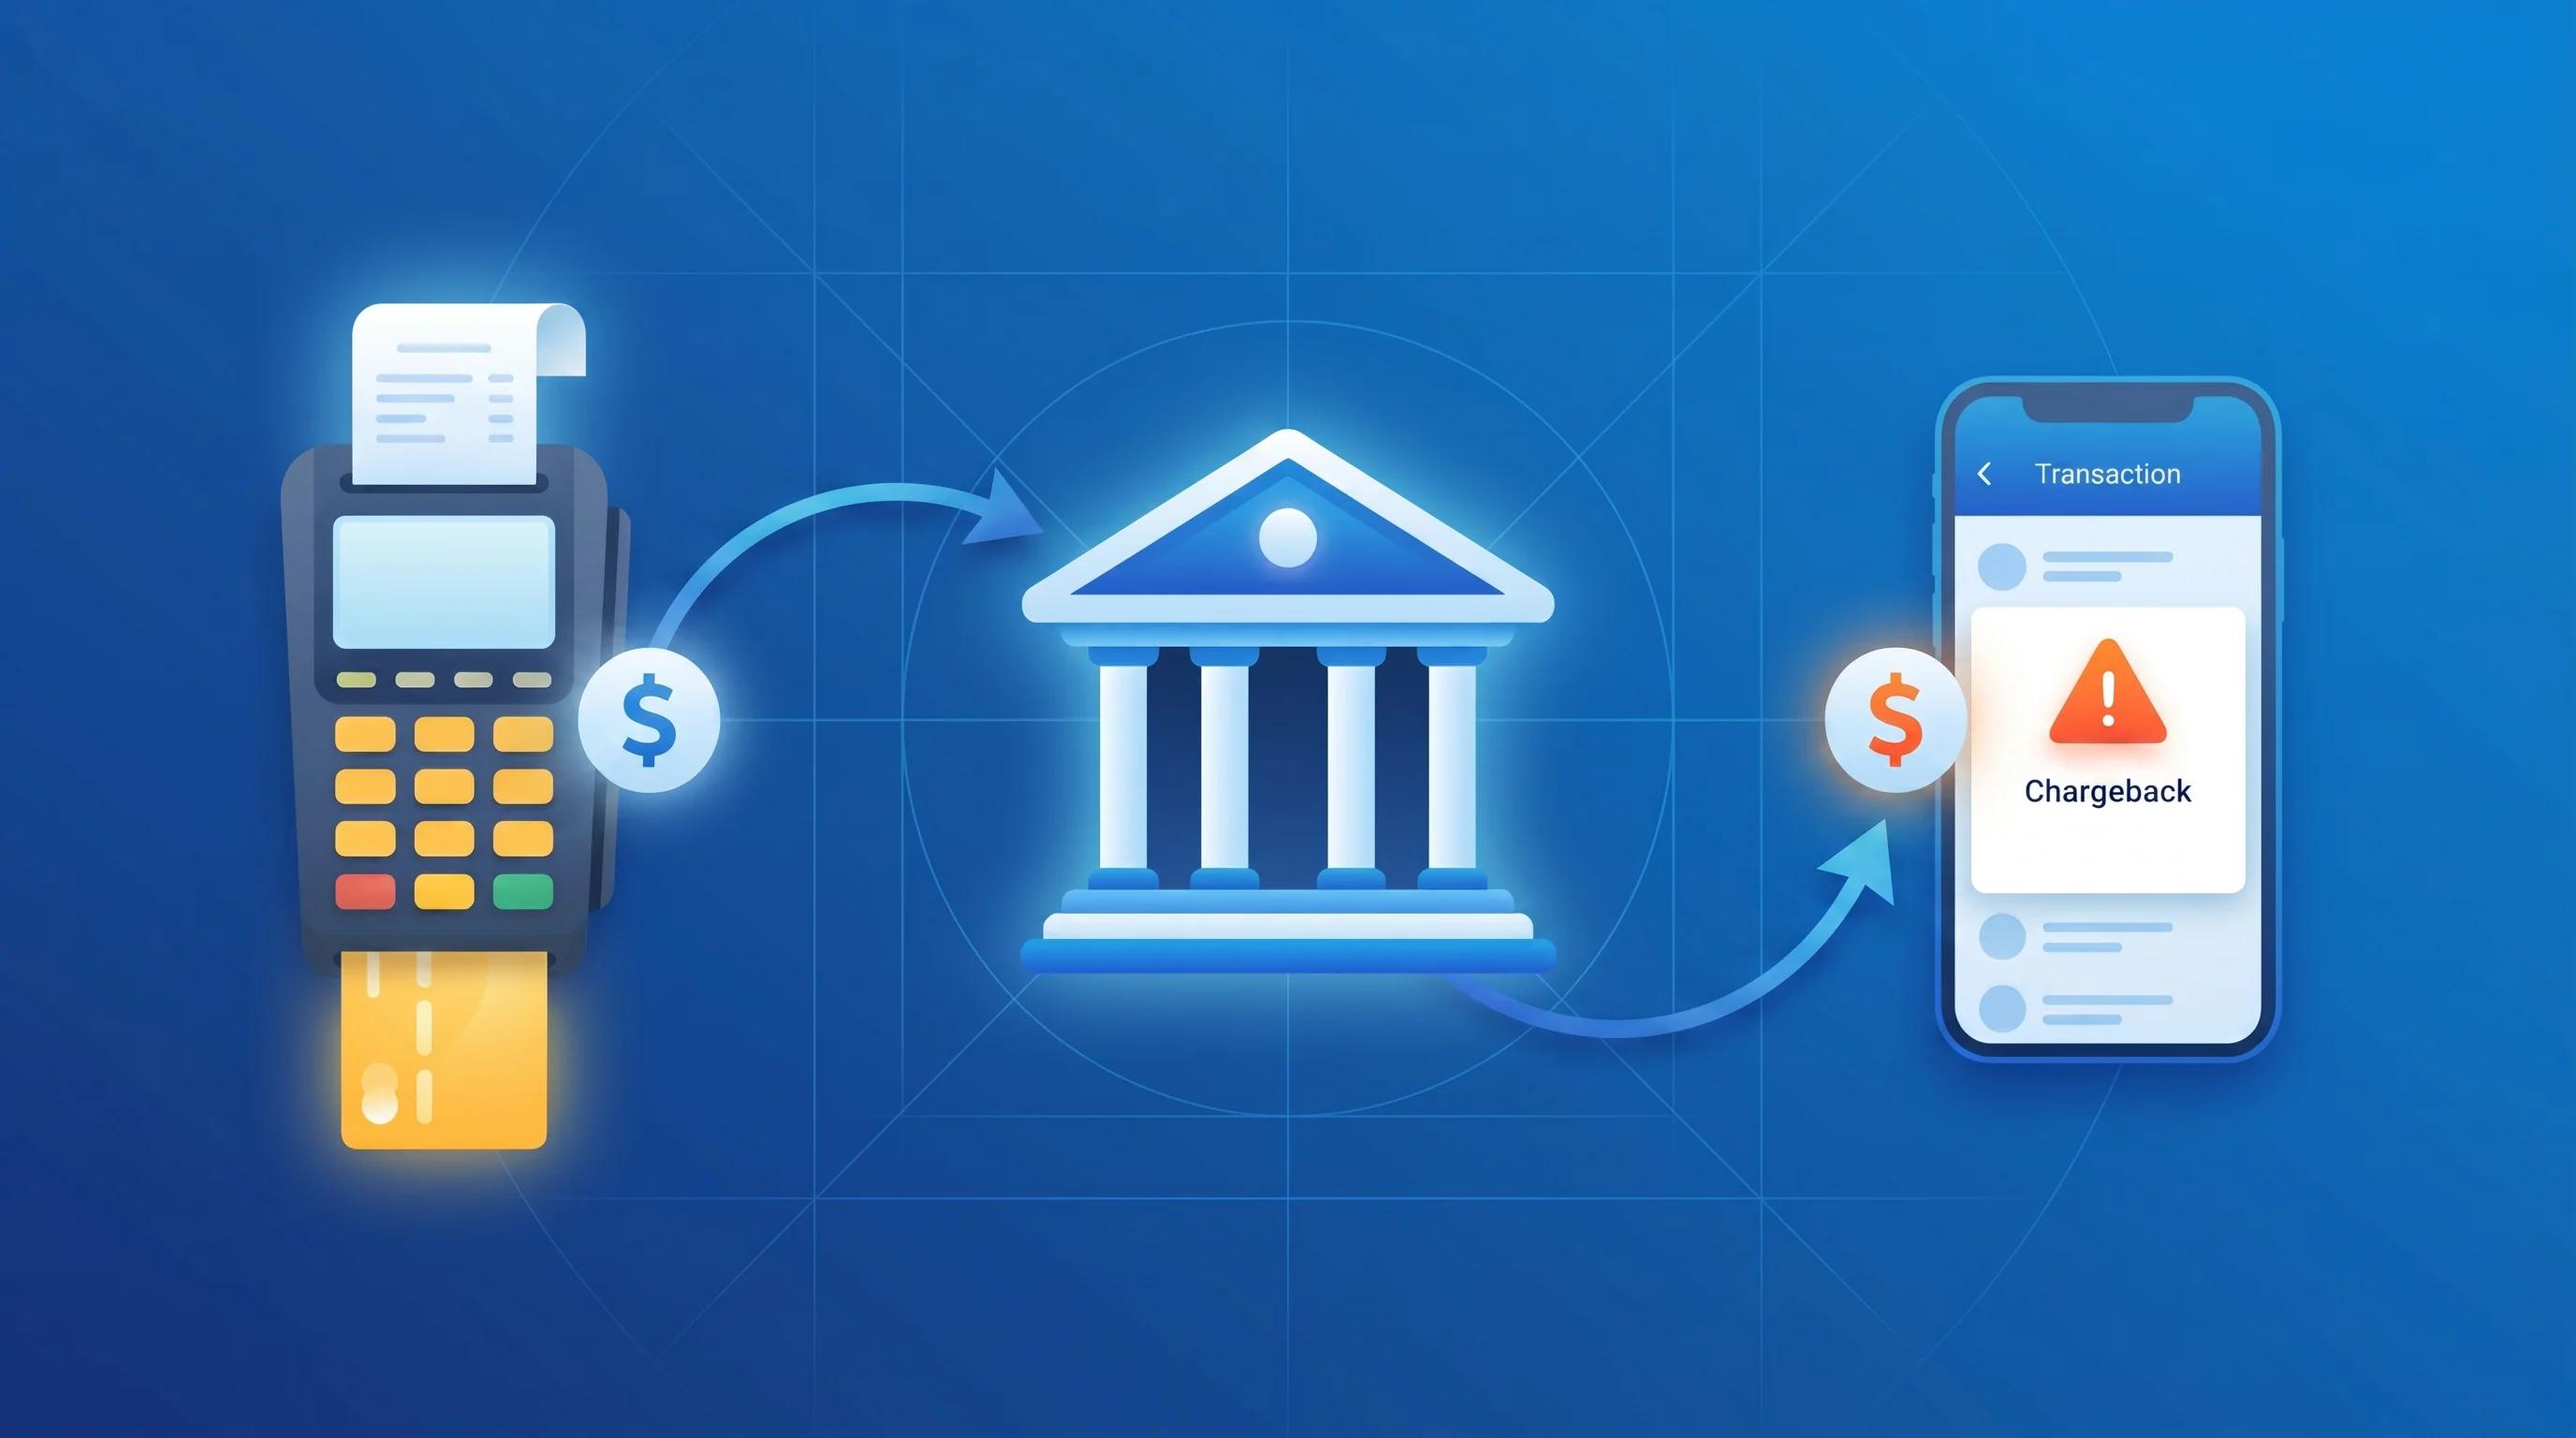
A chargeback is a forced transaction reversal initiated by the cardholder's bank, bypassing the merchant entirely. Unlike a refund (which the merchant controls), a chargeback puts the bank in charge, and the merchant loses the sale, pays a fee, and must spend time building a dispute response just to have a chance at recovery.
The true cost of a single chargeback has four components:
| Cost Component | Typical Range |
| Lost transaction value | $0 - $500+ (varies by order) |
| Dispute / chargeback fee | $15 - $100 per chargeback |
| Cost of goods (if already shipped) | Full product/service cost |
| Internal dispute handling time | $25 - $75 per case (staff time) |
According to LexisNexis Risk Solutions' 2025 True Cost of Fraud study (15th annual edition, surveying 569 fraud and risk executives across the US and Canada), for every $1 of fraud-related chargeback value, merchants absorb an average of $4.61 in total costs once fees, staff time, replacement goods, and downstream authorization impacts are factored in. That figure has risen 32% since 2022, when it stood at $3.16. For high-volume merchants, chargebacks that look like a minor operational nuisance can represent hundreds of thousands of dollars in annual revenue leakage.
Why chargebacks cost more than the transaction amount
The dispute fee alone doesn't explain the full picture. Three additional cost layers amplify the impact.
The authorization rate effect
As chargeback ratios rise, issuing banks and card networks begin treating the merchant as higher risk. This translates directly to lower authorization rates, and more legitimate transactions get declined. A merchant running a 0.8% chargeback ratio is already experiencing measurable authorization rate suppression on otherwise valid transactions. The revenue lost to declined legitimate sales is rarely attributed to chargeback volume, but the connection is causal.
The monitoring program consequence
Visa replaced its former Dispute Monitoring Program (VDMP) in April 2025 with the Visa Acquirer Monitoring Program (VAMP), a consolidated framework covering both disputes and fraud. Under the current VAMP rules, merchants are flagged at the "excessive" level when their combined VAMP ratio (total disputes plus reported fraud divided by settled transactions) reaches 2.2%. That threshold drops to 1.5% for North America, Europe, and Asia Pacific from April 2026. Once inside a monitoring program, merchants face a $ 8-per-dispute fee in the excessive tier and must exit by maintaining compliant ratios for 3 consecutive months. Prevention is cheaper than remediation.
Mastercard's Excessive Chargeback Merchant (ECM) programme operates separately and triggers at 1.5% with 100 or more chargebacks in a month. Above 3% with 300 or more chargebacks, merchants enter the High Excessive Chargeback Merchant (HECM) tier, where monthly fines range from $1,000 to $200,000.
The team cost that never appears in the P&L
Responding to a chargeback representment requires gathering evidence, writing the rebuttal, and submitting documentation within tight card network deadlines. At scale, this becomes a headcount cost that most finance teams never isolate from general operations overhead.
What triggers chargebacks, and which ones are worth fighting
Chargebacks fall into three categories. Each has a different prevention strategy and a different win rate at the representment stage.
True fraud chargebacks
True fraud chargebacks occur when a card is used without the cardholder's knowledge: stolen credentials, account takeover, card-present fraud. These are the chargebacks that payment security tools are designed to prevent. Modern fraud scoring, 3D Secure authentication, and network tokenization significantly reduce this category. Merchants who have implemented strong authentication on high-risk transaction segments typically see this category decline by 40–60%.
Friendly fraud chargebacks
Friendly fraud chargebacks,also called first-party fraud, occur when a legitimate cardholder disputes a transaction they authorized. The cardholder may claim non-delivery, unrecognized charge, or "not as described." Some are genuine mistakes (a family member used the card, or the merchant name on the statement doesn't match the brand name). Many are intentional: the customer received the goods, wants to keep them, and disputes the charge. Friendly fraud now accounts for an estimated 40 - 80% of all chargebacks in e-commerce, according to Chargebacks911's research. This category is the most worth fighting. Evidence of delivery, customer communication logs, and IP/device fingerprinting win a significant percentage of representments.
Processing errors
Processing errors occur when the merchant or payment processor makes a mistake: double-charging a customer, charging after cancellation, or failing to process a refund that was promised. These are the most preventable category and the most defensible from a merchant reputation standpoint. Catching and correcting processing errors before they become chargebacks is simple operational hygiene.
What your chargeback ratio is really telling you
Your chargeback ratio, total chargebacks divided by total transactions in a calendar month, is a leading indicator of payment health, not just a compliance metric.
| Chargeback Ratio | Signal | Card Network Status |
| Below 0.5% | Healthy operations | No monitoring |
| 0.5% - 0.65% | Emerging risk - investigate now | Approaching Visa early warning |
| 0.65%–1.0% | Active risk - remediation needed | Visa VDMP Early Warning |
| Above 1.0% | High risk - potential card termination | Visa VDMP / Mastercard MATCH list risk |
Most merchants only discover they have a chargeback problem when a card network notifies them they're in a monitoring program. At that point, the remediation cost is already significant. The merchants who stay below 0.5% do so through proactive monitoring by tracking dispute reasons by product line, payment method, and customer segment to identify patterns before they compound.
When chargeback ratios exceed 1%, card networks move merchants into monitoring programs, which add fees and can lead to card acceptance termination. The 1% threshold is not a guideline; it's the line between normal operations and active remediation.
How to reduce chargebacks before they happen
Prevention is more cost-effective than dispute resolution. These five practices consistently reduce chargeback ratios for merchants operating across multiple markets.
- Improve transaction clarity on card statements. The single most common cause of unintentional friendly fraud is the customer not recognizing the charge on their statement. A merchant operating as "XYZ Holdings LLC" but selling under the brand "ShopQuick" will generate disputes from customers who don't connect the statement descriptor to their purchase. Updating the merchant descriptor to match the brand name eliminates a meaningful percentage of "unrecognized charge" disputes.
- Implement 3D Secure authentication on high-risk segments. 3DS authentication shifts liability from the merchant to the issuing bank for authenticated transactions. A cardholder cannot initiate a fraud chargeback on a 3DS-authenticated transaction.The bank absorbs the liability. For merchants selling digital goods, subscription products, or high-value items, applying 3DS intelligently (not universally, which hurts conversion) to risk-flagged transactions is one of the highest-ROI chargeback reduction strategies available.
- Proactively issue refunds before disputes escalate. A refund costs the merchant the transaction value. A chargeback costs the merchant the transaction value plus $15–$100 in fees plus staff time plus chargeback ratio impact. For orders with a high dispute risk( delayed delivery, out-of-stock situations, returns in progress) proactively issuing a refund before the customer disputes saves significantly on net basis.
- Respond to every dispute with evidence, not just the ones that look winnable. Merchants who selectively dispute chargebacks,only fighting cases where they have strong evidence, are training customers (and the card networks) to expect low resistance. A consistent practice of submitting well-documented representments, even for smaller values, demonstrates to card networks that the merchant has active fraud management in place. This matters when they evaluate your ratio against program thresholds.
- Monitor dispute reasons at the SKU and channel level. A 0.9% aggregate chargeback ratio may hide a 4% rate on one product category or one traffic source. Merchants who break down dispute reasons by product, geography, and customer segment identify the concentrated problems: a specific influencer promotion driving refund abuse, a geography with abnormal fraud rates, a product category with chronic "not as described" disputes . They'd address them at the source.
What payment orchestration does for chargeback management
Managing chargebacks across multiple payment providers manually is an operational challenge that grows with business scale. When a merchant processes payments through three PSPs across twelve markets, dispute data, evidence submission deadlines, and outcome tracking exist in three separate portals with different interfaces and different response deadline calendars.
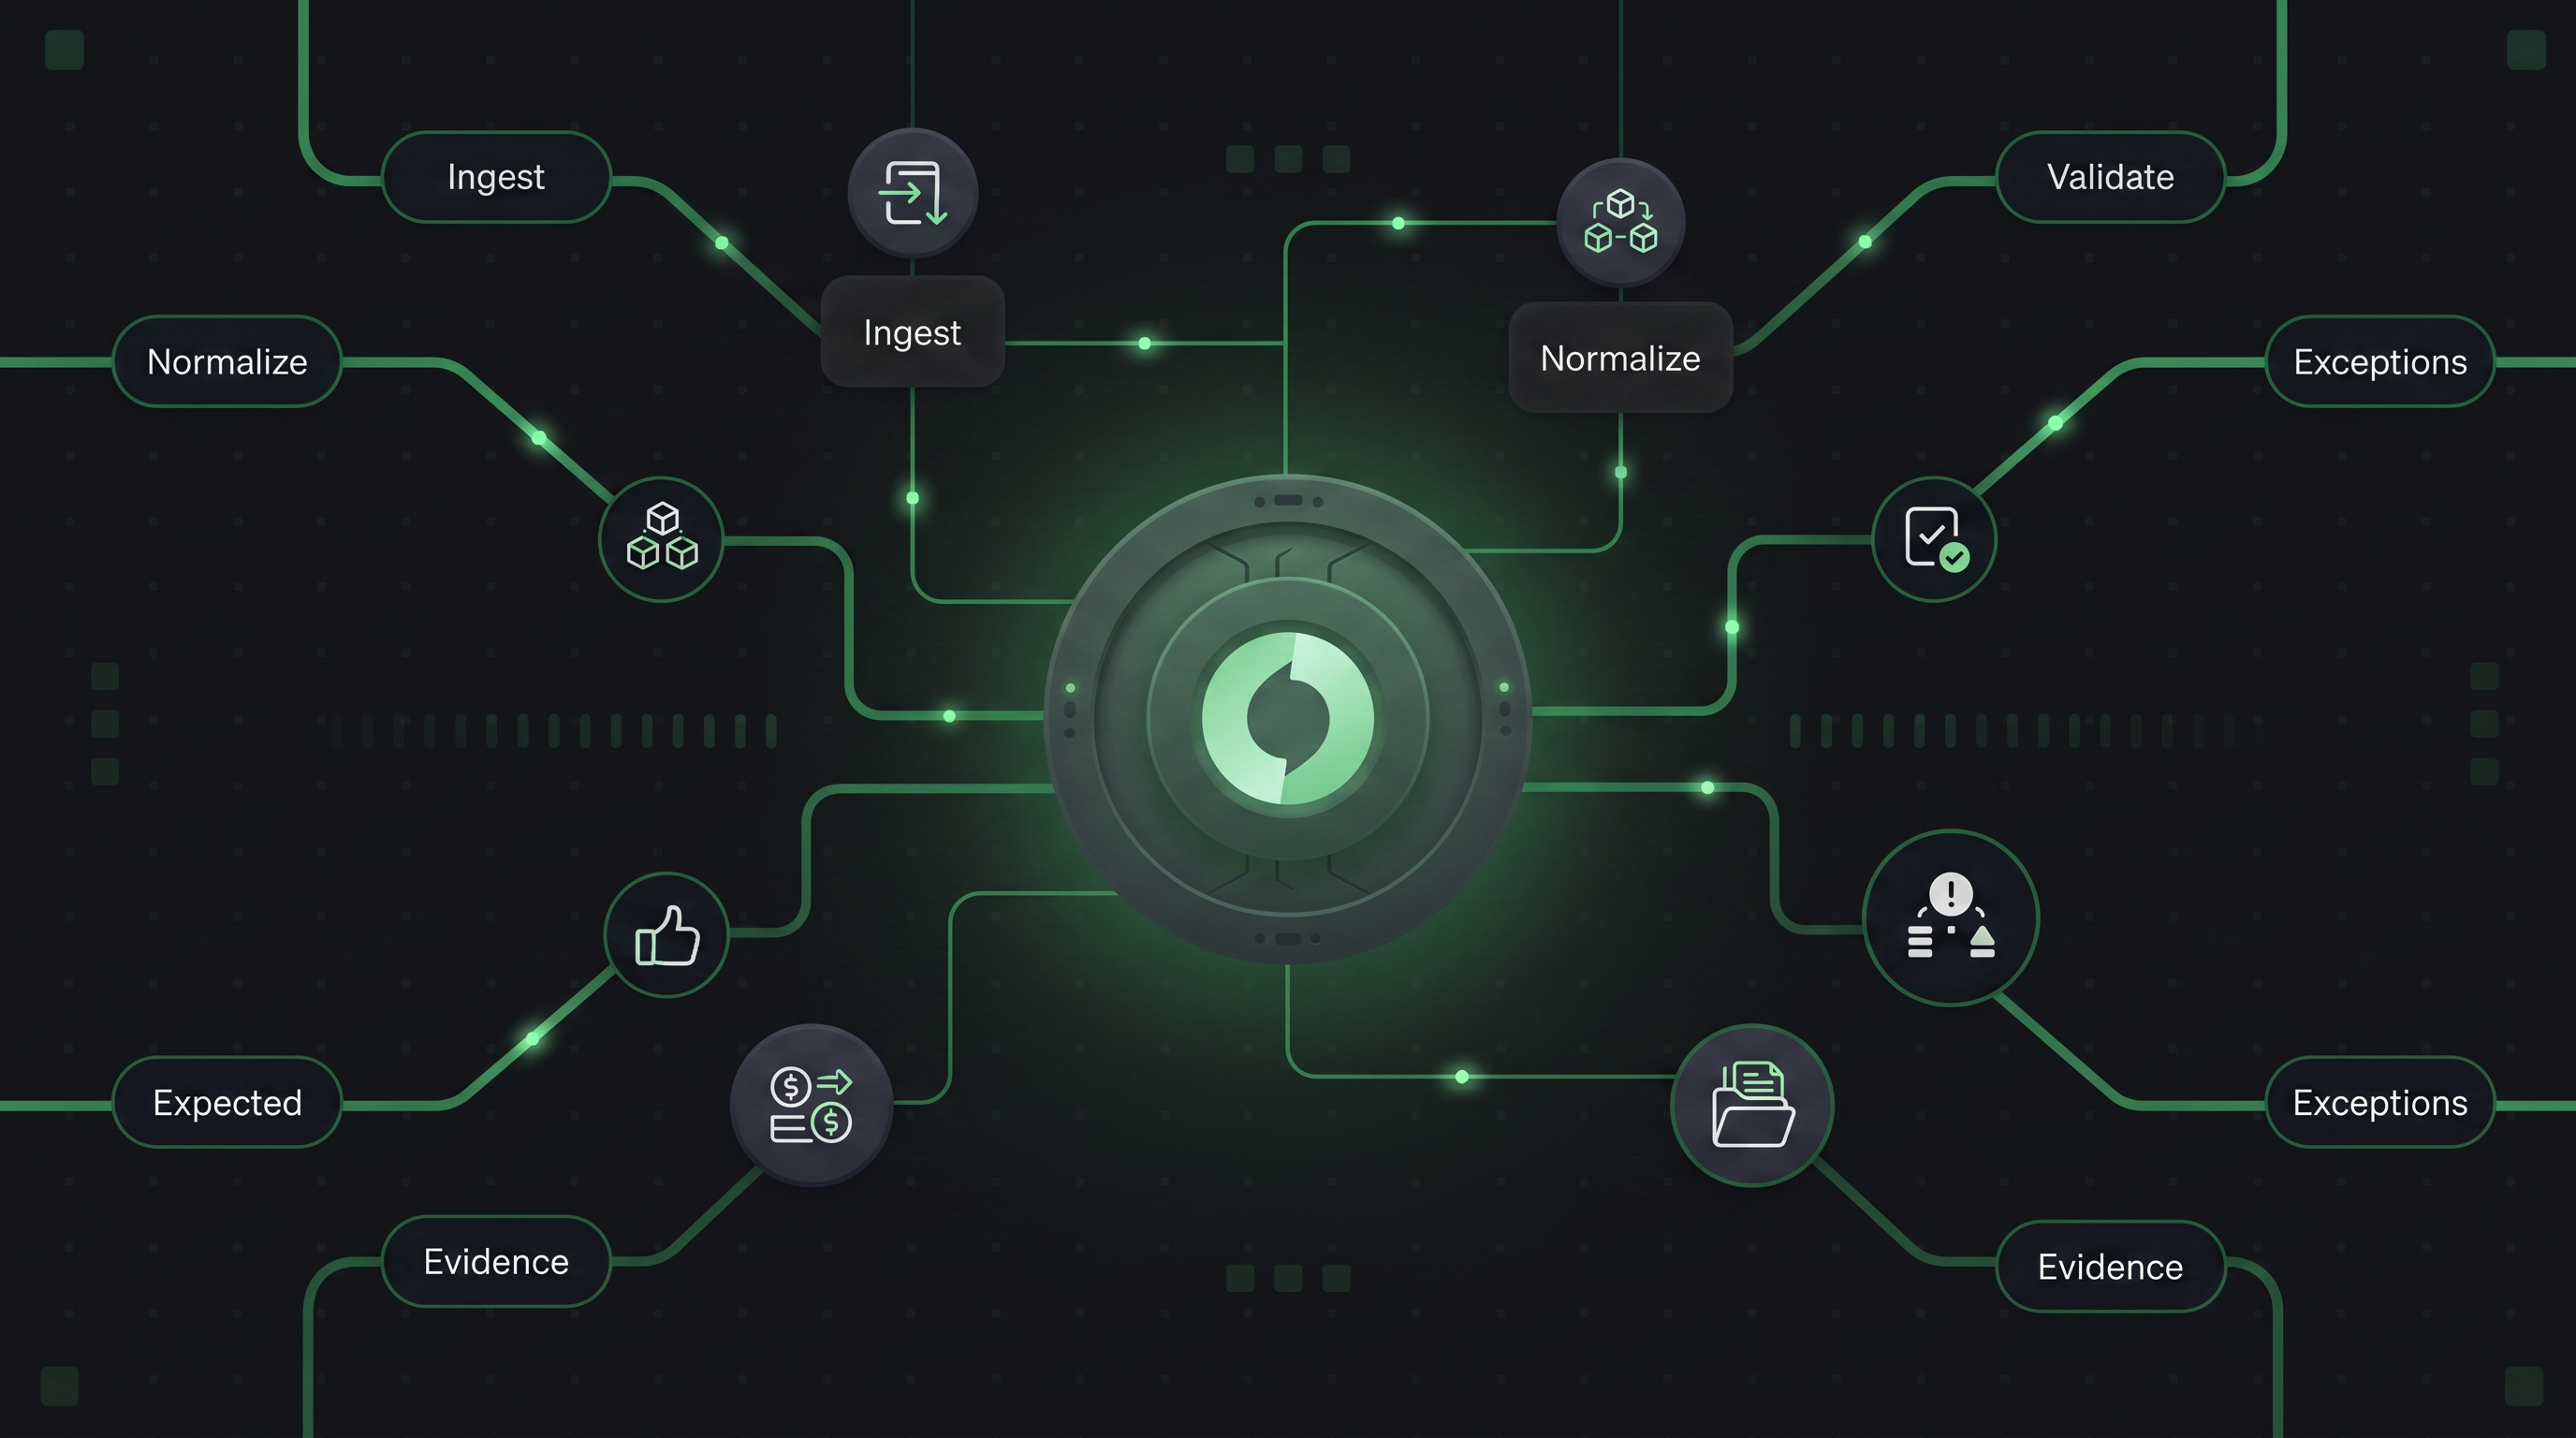
Payment orchestration centralizes dispute management. Instead of three portals, one dashboard. Instead of three deadline calendars, one alert system. Instead of manually correlating dispute patterns across PSPs, one analytics layer that shows where disputes cluster : by provider, by geography, by product, by customer segment.
Juspay Hyperswitch orchestrates payments for enterprises including Amazon, Google, HSBC, and Agoda across 150+ countries, processing 300 million daily transactions. For merchants operating across multiple geographies and multiple payment providers, Juspay's dispute management layer provides:
- Centralized dispute visibility: Disputes across all connected PSPs with one view of dispute ratios, pending responses, and deadline calendars
- Automated evidence gathering: Transaction records, IP/device data, delivery confirmations, and authentication logs compiled automatically for representment
- Dispute reason analytics: Breaking down chargebacks by reason code, geography, PSP, and product to identify systematic patterns
- 3DS routing optimization: Applying 3D Secure authentication selectively to high-risk transaction segments without applying it universally and harming conversion
Key Takeaways
- The true cost of a chargeback is 2–3x the transaction value when fees, staff time, and authorization rate effects are included
- Friendly fraud now accounts for 40–80% of e-commerce chargebacks, and is winnable with evidence
- Visa retired the VDMP in April 2025 and replaced it with VAMP. The current excessive merchant threshold is 2.2%, dropping to 1.5% for key regions in April 2026
- Mastercard's ECM programme triggers at 1.5% with 100+ chargebacks per month
- Prevention strategies (descriptor clarity, 3DS on risk segments, proactive refunds) cost less than dispute resolution
- Consistent dispute response, even for smaller transactions,matters for card network standing
- Payment orchestration centralizes dispute management across PSPs, reducing operational overhead and improving visibility
Frequently Asked Questions
What is the average cost of a chargeback for merchants?
According to LexisNexis Risk Solutions' 2025 True Cost of Fraud Study, US merchants absorb an average of $4.61 for every $1 of fraud-related chargeback value, once fees, staff time, and secondary costs are included. Chargeback fees themselves range from $15 to $100 per incident depending on the payment processor, and this is separate from the lost transaction value and any cost of goods already delivered.
What is a chargeback ratio and what should it be?
A chargeback ratio is total chargebacks divided by total transactions in a given month, expressed as a percentage. Mastercard's Excessive Chargeback Merchant programme triggers at 1.5% with 100+ chargebacks per month. Visa's current VAMP programme flags merchants at an "excessive" ratio of 2.2% (falling to 1.5% in North America, Europe, and Asia Pacific from April 2026). Most payment optimization teams target below 0.5% as a healthy operating baseline.
What is the difference between a chargeback and a refund?
A refund is initiated by the merchant, and the merchant returns money to the customer, and both sides agree the transaction is resolved. A chargeback is initiated by the cardholder's bank, bypassing the merchant entirely. Chargebacks carry fees and ratio implications that refunds do not. For most merchants, issuing a refund is cheaper than allowing a dispute to become a chargeback.
Can merchants win chargeback disputes?
Yes.Merchants who submit complete evidence (proof of delivery, authentication records, customer communication, IP/device fingerprinting, signed agreements) win a significant percentage of representments, particularly for friendly fraud cases. Industry estimates suggest merchants win 40%+ of well-evidenced disputes. The key is consistent evidence collection and submission, not selective fighting of only "obvious" wins.
What is friendly fraud and why is it rising?
Friendly fraud occurs when a legitimate cardholder disputes a transaction they authorized, claiming non-delivery, unrecognized charge, or "not as described", to receive both the goods and a refund. It now accounts for an estimated 40–80% of e-commerce chargebacks. It's rising because online dispute filing has become frictionless, enforcement by banks is inconsistent, and many merchants accept disputes rather than challenge them.
How does 3D Secure authentication help with chargebacks?
3DS authentication shifts liability from the merchant to the issuing bank for authenticated transactions. If a customer completes 3DS authentication and later disputes the charge as fraud, the bank absorbs the loss, and not the merchant.Merchants applying 3DS to high-risk transaction segments (high-value purchases, new customers, flagged geographies) can significantly reduce their fraud chargeback exposure without applying it universally and harming conversion rates.
What happens when a merchant's chargeback ratio gets too high?
Card networks operate monitoring programs that trigger at specific thresholds. Visa's consolidated VAMP program flags merchants as "excessive" at a 2.2% combined dispute and fraud ratio (dropping to 1.5% in key regions from April 2026). Mastercard's ECM triggers at 1.5% with 100+ disputes per month. Inside these programs, merchants pay per-dispute fees and must submit remediation plans. Continued non-compliance can result in termination of card acceptance and placement on the MATCH list (Terminated Merchant File), making it extremely difficult to secure a new payment processor.
How does payment orchestration help reduce chargebacks?
Payment orchestration centralizes dispute management across multiple PSPs, provides unified analytics on dispute patterns, automates evidence gathering for representments, and enables intelligent 3DS routing on risk-flagged transactions. For merchants operating across multiple geographies, orchestration replaces three or more separate dispute portals with one view reducing operational overhead and ensuring no response deadlines are missed.